


Queensland
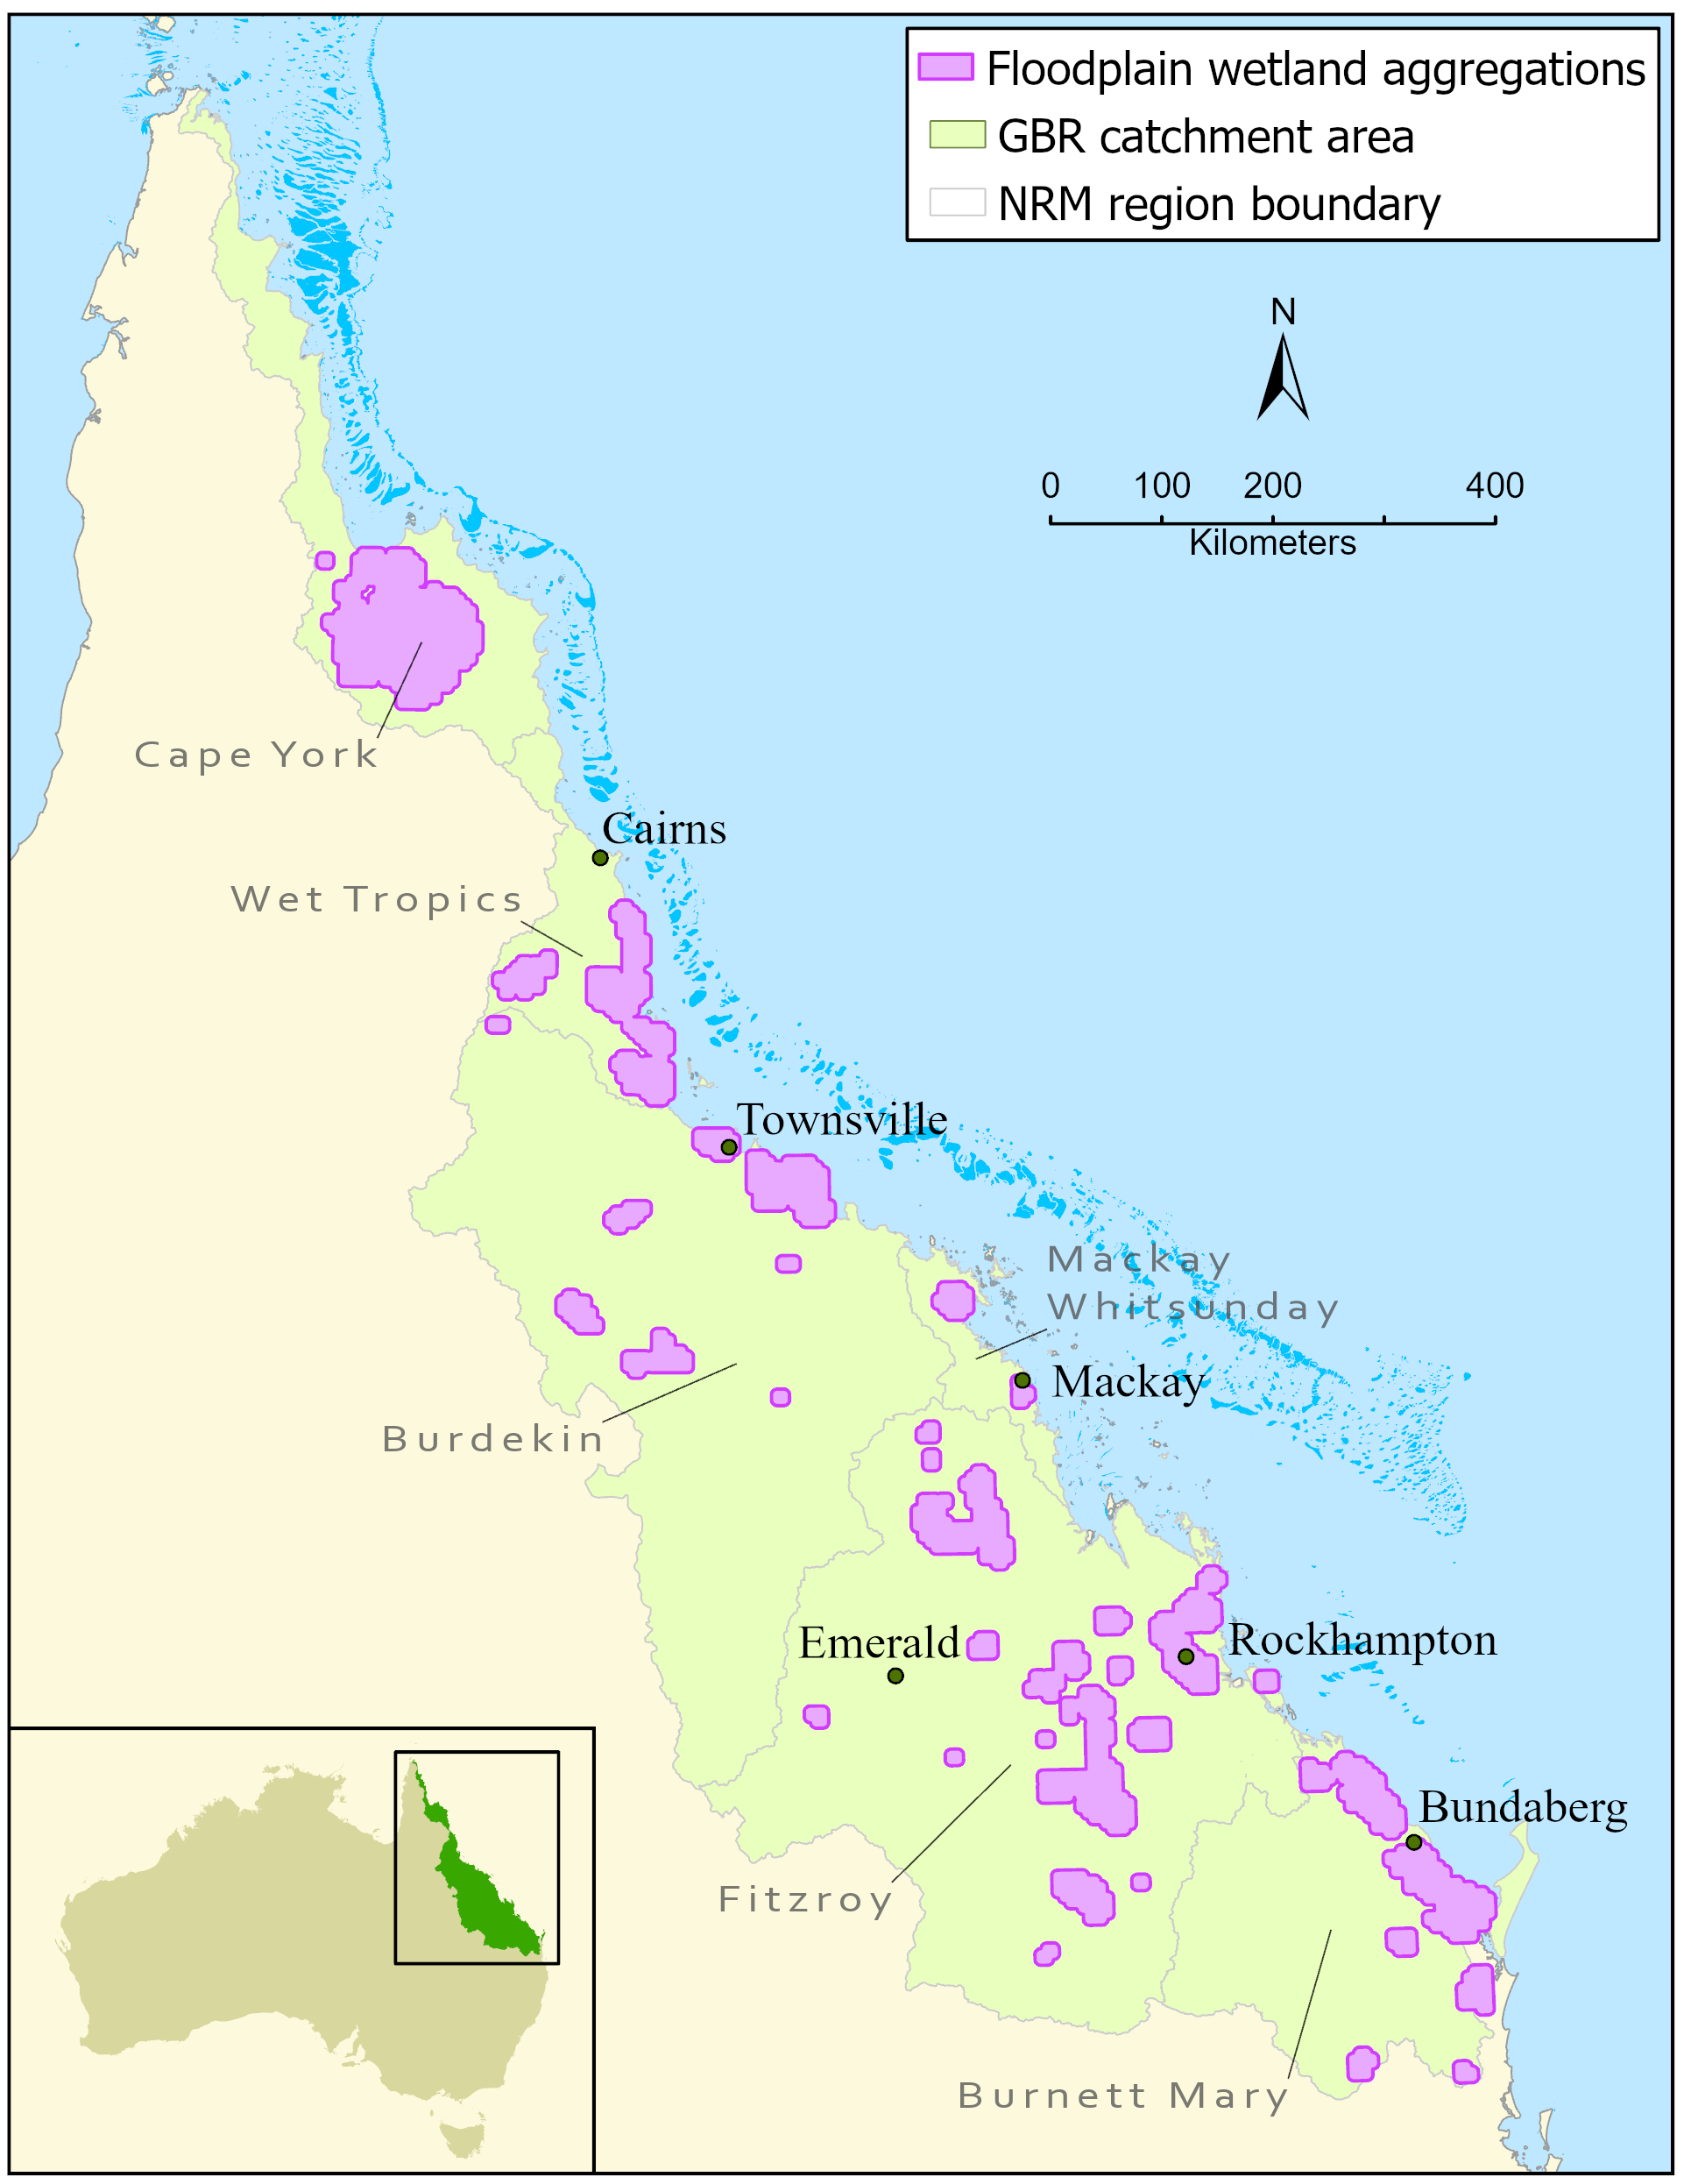
We have monitored human-induced pressures on natural, freshwater floodplain wetlands (lakes and vegetated swamps) located in major aggregations within the Great Barrier Reef catchment annually since 2016. This monitoring enables us to analyse the change in the overall pressure on wetlands over time (annual trend).
We also analyse the annual trend for four types of pressure:
- pest plant and animal introductions,
- habitat modification,
- water regime change,
- pollutant inputs.
A change in pressure may be expected to translate into a change in wetland condition over time.
During 2016-2022, there was:
- no annual reduction or increase in the overall pressure on Great Barrier Reef catchment freshwater floodplain wetlands,
- a small annual increase in the pressure on Great Barrier Reef catchment wetlands associated with water-regime change.
Wetland Tracker
In the Great Barrier Reef wetland condition monitoring program, we use the rapid assessment method, Wetland Tracker. It measures progress towards the improved wetland condition objective of the Reef 2050 Long Term Sustainability Plan, including the Reef 2050 Water Quality Improvement Plan.
We use desktop analysis based on imagery and spatial data to score a set of indicators primarily related to pressure on the wetlands.
Pressures include:
- pest plant and animal introductions,
- habitat modification,
- water regime changes,
- pollution.
We collect data from the field to ground-truth desktop indicators and score another set of indicators primarily related to the condition of wetlands.
These indicators include:
- biological and physical integrity,
- local hydrology,
- connectivity to nearby wetlands and native vegetation.
We analyse the scores from individual wetlands together to generate the overall pressure and condition scores and trends for Great Barrier Reef catchment wetlands.
Regional summaries
Since 2020, the number of wetlands we survey annually has increased gradually to enable the assessment and reporting of wetland condition for Natural Resource Management (NRM) regions in addition to the Great Barrier Reef catchment assessment and reporting.
We have collected baseline data on the pressures affecting natural freshwater floodplain wetlands in major aggregations within these regions:
- Wet Tropics,
- Burdekin,
- Fitzroy,
- Burnett Mary.
In future years, we may compare the baseline data with annual data to assess changes over time in the condition of the regions’ wetlands.
An increased survey effort did not occur in the Mackay Whitsunday or Cape York NRM regions because of constrained sample size and logistical constraints, respectively.


