
Skip to content

Annual rainfall and pasture growth relative to historical records

Annual rainfall and pasture growth relative to historical records

Key Finding

Queensland (and most regions of Australia) received above-average rainfall for the three-year period (April 2021 to March 2024). This rainfall has been positive for agriculture and the environment compared to all other three-year periods.

More information:

Relevant Sustainable Development Goals’ targets

Relevant Global Biodiversity Framework targets

One-year Queensland rainfall percentiles from April 2021 to March 2022 (relative to annual historical records)
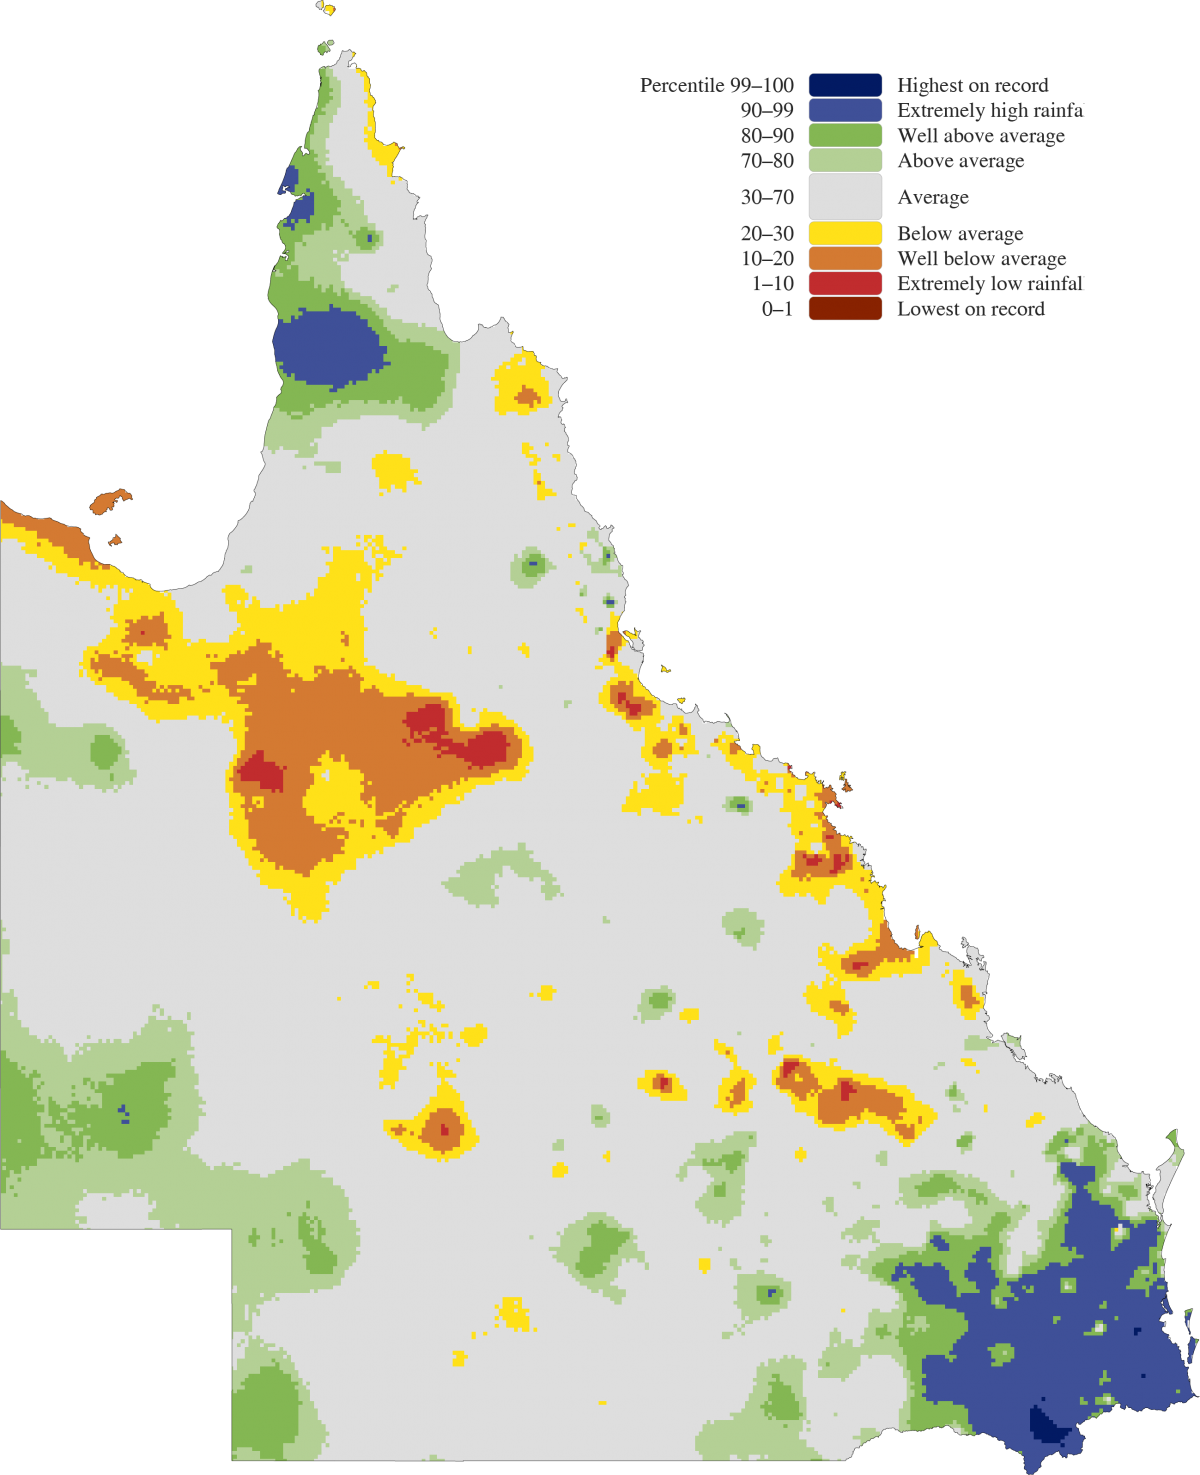
One-year Queensland rainfall percentiles from April 2021 to March 2022 (relative to annual historical records)
These maps show the last three one-year periods (April-March) of rainfall and modelled pasture growth for Queensland as percentiles (i.e. relative to history). They compare these annual periods (on a 0.05˚ × 0.05˚ grid) with every other annual period (April–March for 1890-2024) in the historical dataset after being ranked lowest to highest.

One-year Queensland modelled pasture growth percentiles from April 2021 to March 2022 (relative to the annual period of historical records)

One-year Queensland modelled pasture growth percentiles from April 2021 to March 2022 (relative to the annual period of historical records)
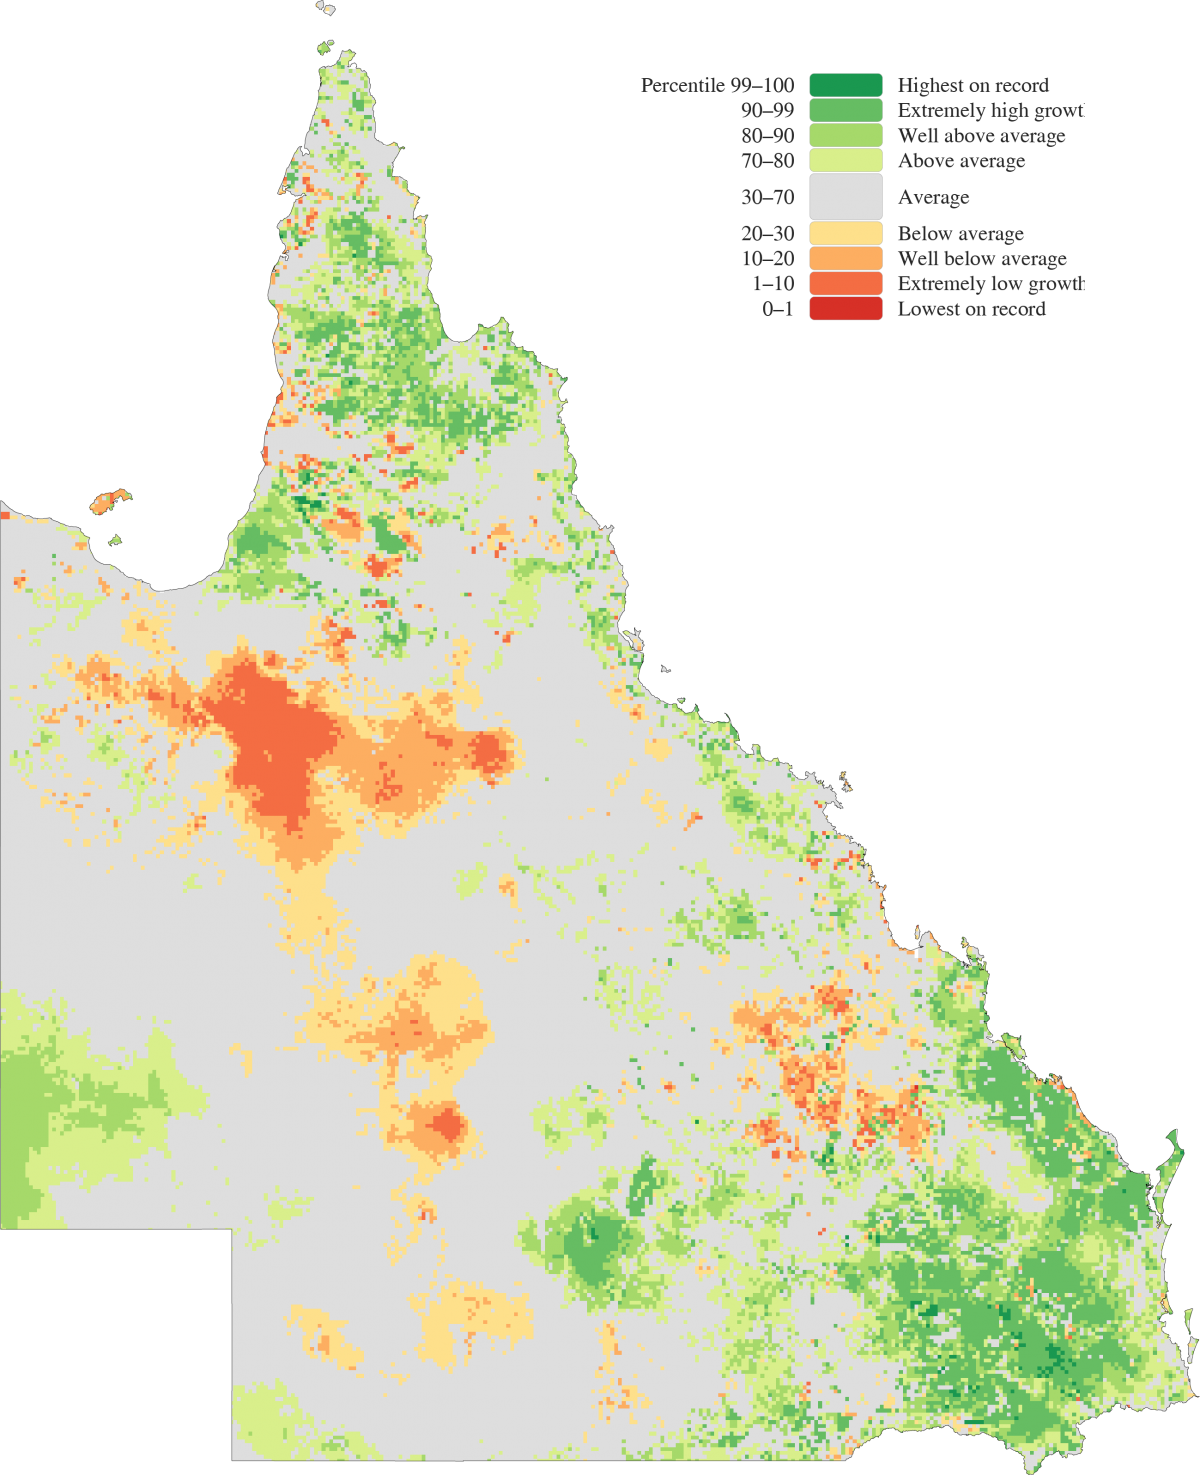
These maps show the last three one-year periods (April-March) of rainfall and modelled pasture growth for Queensland as percentiles (i.e. relative to history). They compare these annual periods (on a 0.05˚ × 0.05˚ grid) with every other annual period (April–March for 1890-2024) in the historical dataset after being ranked lowest to highest.

One-year Queensland rainfall percentiles from April 2022 to March 2023 (relative to the annual period rainfall historical records)

One-year Queensland rainfall percentiles from April 2022 to March 2023 (relative to the annual period rainfall historical records)
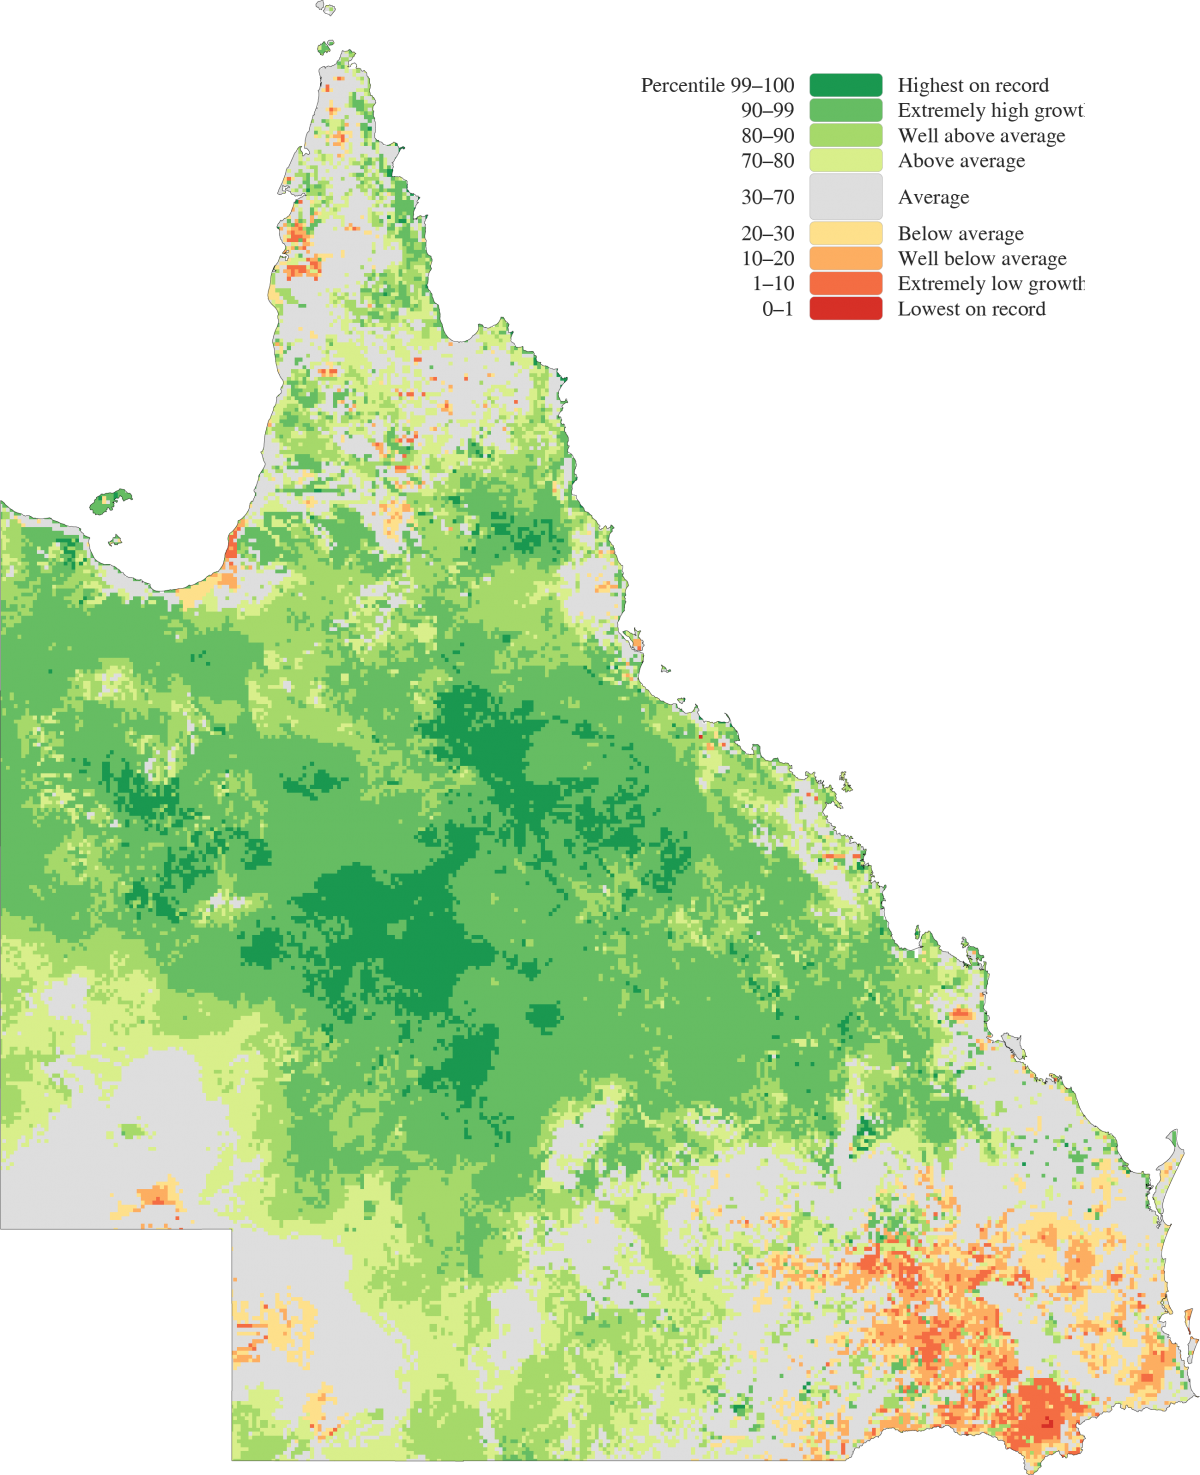
These maps show the last three one-year periods (April-March) of rainfall and modelled pasture growth for Queensland as percentiles (i.e. relative to history). They compare these annual periods (on a 0.05˚ × 0.05˚ grid) with every other annual period (April–March for 1890-2024) in the historical dataset after being ranked lowest to highest.

One-year Queensland modelled pasture growth percentiles from April 2022 to March 2023 (relative to the annual period rainfall historical records)

One-year Queensland modelled pasture growth percentiles from April 2022 to March 2023 (relative to the annual period rainfall historical records)
These maps show the last three one-year periods (April-March) of rainfall and modelled pasture growth for Queensland as percentiles (i.e. relative to history). They compare these annual periods (on a 0.05˚ × 0.05˚ grid) with every other annual period (April–March for 1890-2024) in the historical dataset after being ranked lowest to highest.

One-year Queensland rainfall percentiles from April 2023 to March 2024 (relative to the annual period rainfall historical records)

One-year Queensland rainfall percentiles from April 2023 to March 2024 (relative to the annual period rainfall historical records)
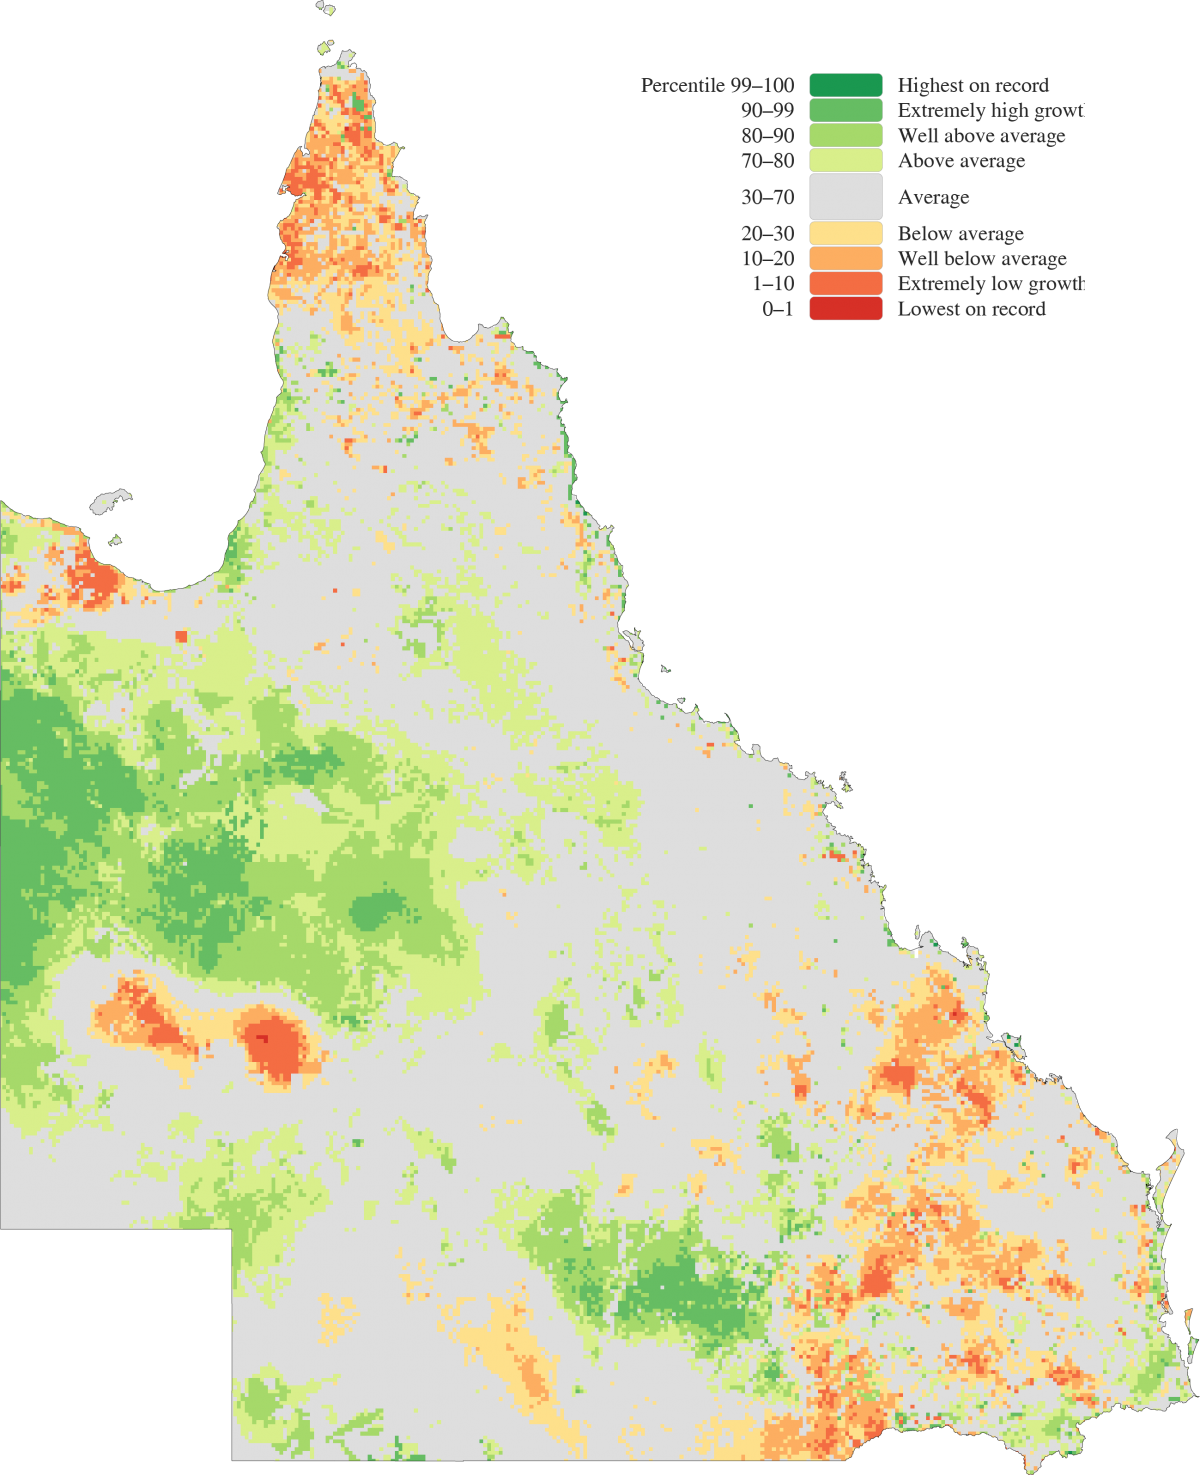
These maps show the last three one-year periods (April-March) of rainfall and modelled pasture growth for Queensland as percentiles (i.e. relative to history). They compare these annual periods (on a 0.05˚ × 0.05˚ grid) with every other annual period (April–March for 1890-2024) in the historical dataset after being ranked lowest to highest.

One-year Queensland pasture growth percentiles from April 2023 to March 2024 (relative to the annual period rainfall historical records)

One-year Queensland pasture growth percentiles from April 2023 to March 2024 (relative to the annual period rainfall historical records)
These maps show the last three one-year periods (April-March) of rainfall and modelled pasture growth for Queensland as percentiles (i.e. relative to history). They compare these annual periods (on a 0.05˚ × 0.05˚ grid) with every other annual period (April–March for 1890-2024) in the historical dataset after being ranked lowest to highest.