


Long Paddock - MyFORAGE soils
Erodible soils and available soil phosphorous mapping using FORAGE and MyFORAGE online tools
FORAGE is an online system that generates reports for rural properties (lot/s on plan) larger than a hectare in area. The MyFORAGE online mapper also enables users to draw or import paddock boundaries to improve the visual and spatial scale of the report information.
There are currently 15 reports, including ground cover, long-term carrying capacity and fire scar reports. Graziers regularly request the Erodible Soils and the Indicative Soil Phosphorus reports.
The FORAGE and MyFORAGE tools are available through The Long Paddock website (Figure 1), which gets more than 17,000 visits each month (on average). The site provides scientific information and data useful for land management decision-making and planning.
 © Queensland Government
The Spyglass Beef Research Facility story demonstrates how FORAGE property reports, such as soil erodibility and available soil phosphorous, can inform sustainable land management and production.
The Spyglass Beef Research Facility
The Spyglass Beef Research Facility is managed by the Queensland Department of Primary Industries, where research is conducted that advances tropical and subtropical beef production and ecosystem management. It hosts extension, education and training programs vital for the Queensland’s beef industry’s future profitability and sustainability.
The research facility covers 38,300 hectares, approximately 130km west of Townsville. It has a 13km frontage on the Burdekin River (Figure 2). The facility’s estimated carrying capacity is up to 3,500 adult equivalent cattle.
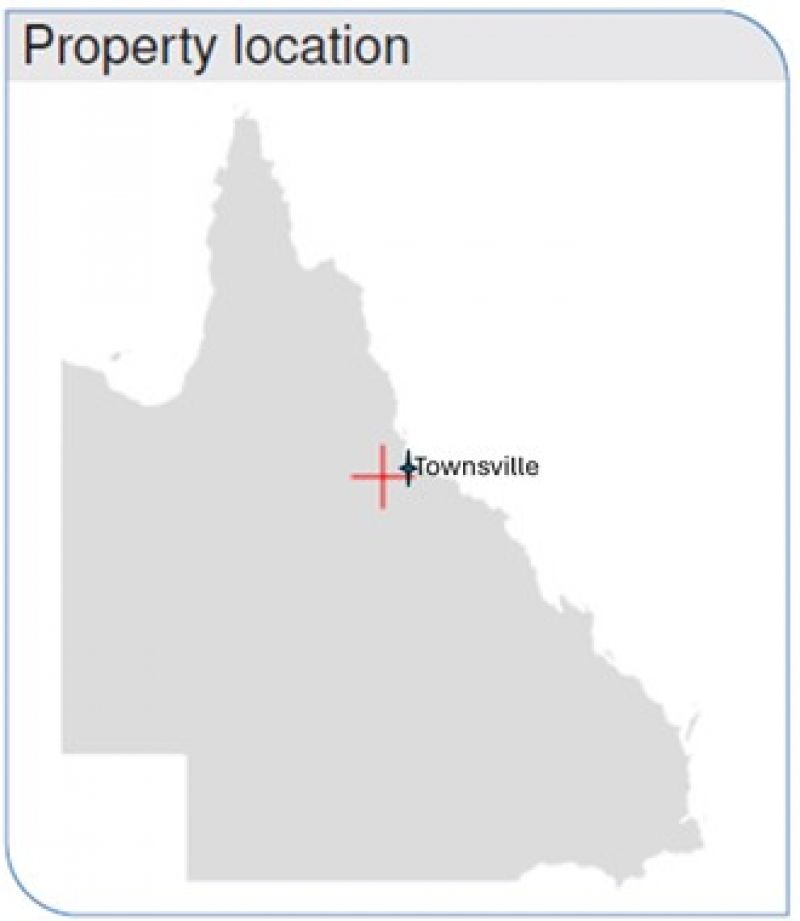 © Queensland Government
The facility’s location in the Charters Towers district is typical of the extensive breeding systems in North Queensland and of grazing lands in the Great Barrier Reef catchments.
Erodible Soils report
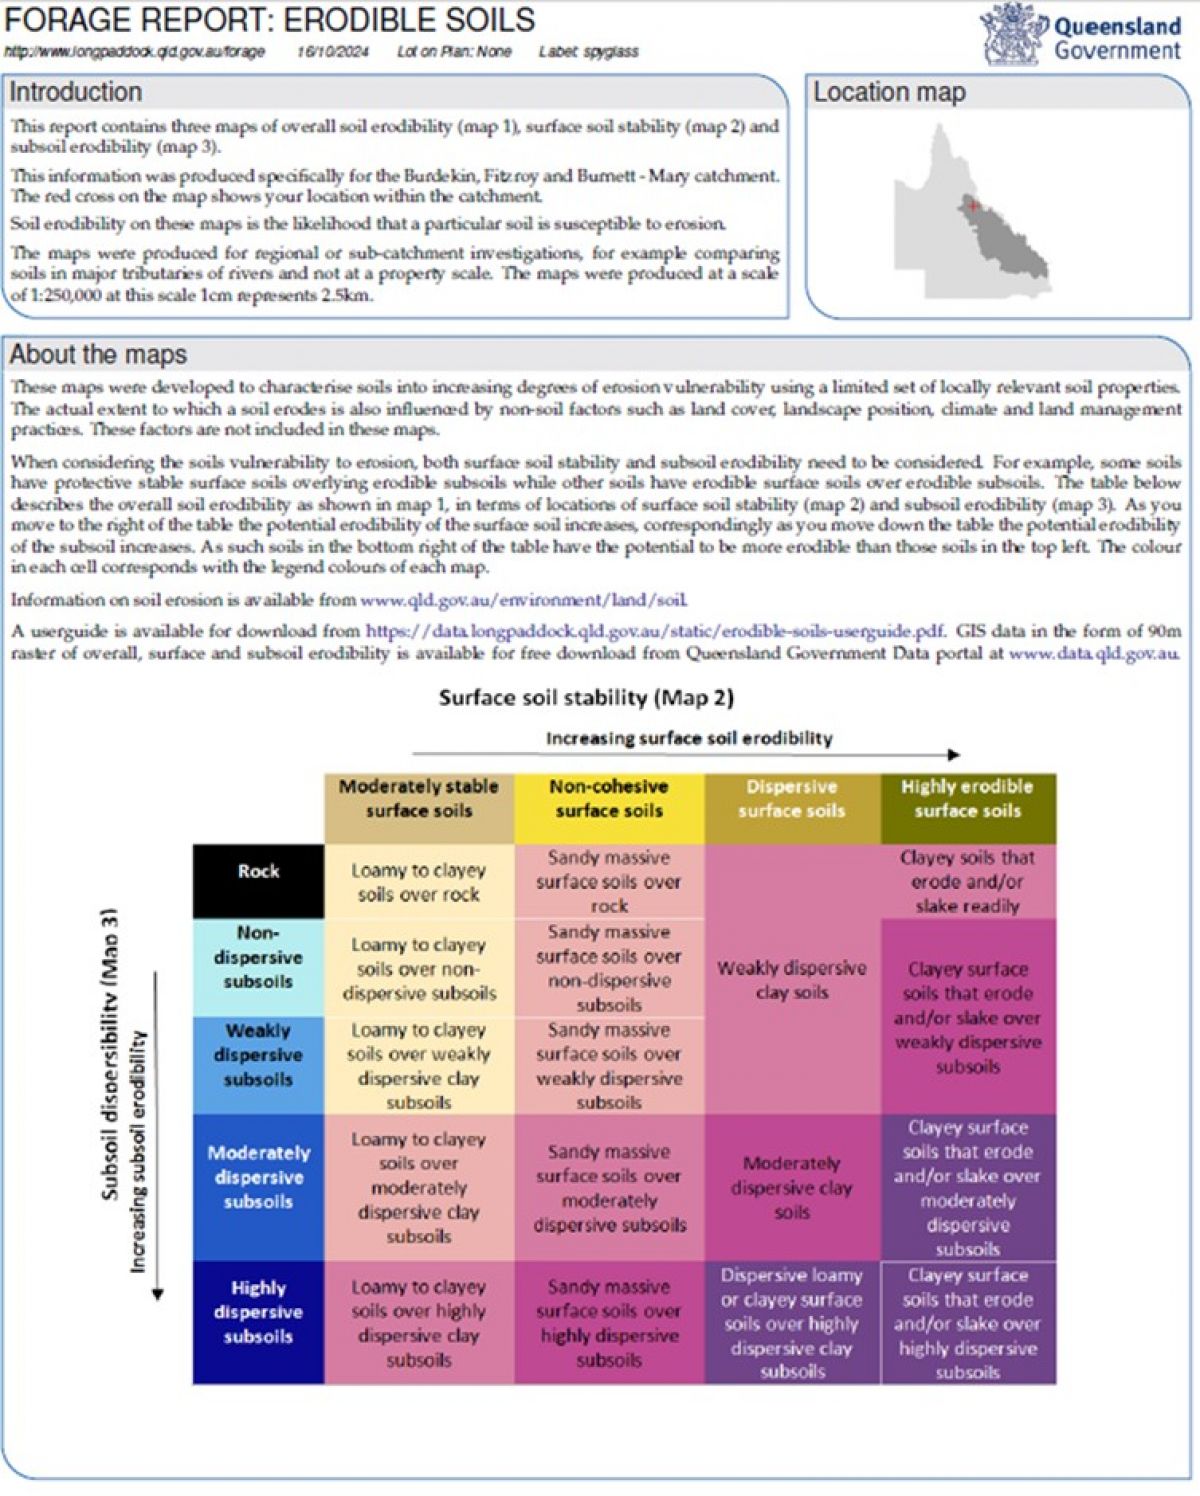
The Erodible Soils report provides information on how likely the soils at a particular location are susceptible to erosion (Figure 3).
 © Queensland Government
This report and maps characterise soils according to their increasing degrees of erosion vulnerability, using a limited set of locally relevant soil properties.
Non-soil factors, such as land cover, landscape position, climate and land management practices, also influence the extent to which a soil erodes. The maps do not include these factors.
The Spyglass Beef Research Facility report contained the following maps (and featured below):
- overall soil erodibility (Map 1)
- surface soil stability (Map 2)
- subsoil erodibility (Map 3).
This Erodible Soils report was produced for the Burdekin, Fitzroy and Burnett Mary catchments at a scale of 1:250,000. At this scale, 1cm represents 2.5km. The red boundary on the map shows the property’s location.
The soil erodibility shown on these maps represents the likelihood that a particular soil is susceptible to erosion. The maps were produced for use at a regional or sub-catchment scale, for example, to compare soils in major river tributaries.
When considering the soils’ vulnerability to erosion, both the surface soil stability and subsoil erodibility must be considered. For example, some soils have protective, stable surface soils overlying erodible subsoils, while others have erodible surface soils over erodible subsoils.
Knowledge of erodible soils can assist land managers with property activities such as:
- fence placement
- pasture improvement
- timber control
- considering stocking densities.
 © Queensland Government
 © Queensland Government
 © Queensland Government
Indicative Soil Phosphorus report
The Indicative Soil Phosphorus report provides the status of soil phosphorus, which affects the phosphorus concentration in pastures.
Phosphorus (P) plays an essential role in converting grass to energy for livestock, the growth and development of body tissue, the development of the foetus, and milk production in pregnant and lactating cows.
Extremely low or very low available P soils may result in low plant-available P and, hence, P deficiency in cattle. Symptoms of P deficiency include bone chewing, which also increases the risk of cattle contracting botulism.
The report provides:
- the inherent soil information (i.e. the natural soil with no P fertiliser)
- plant available P concentration (indicative)
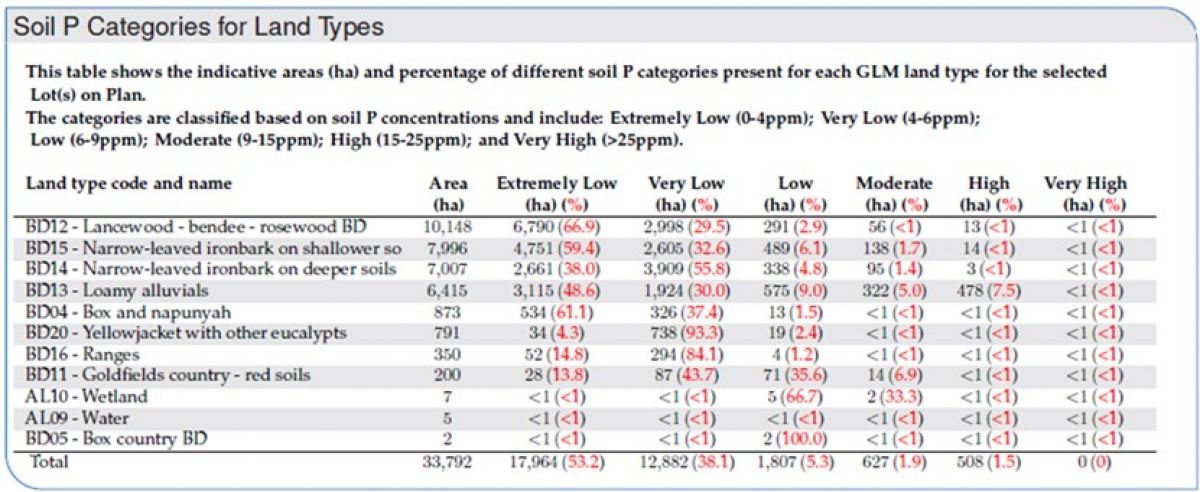
- the areas of different soil P categories for different Grazing Land Management (GLM) land types for the selected lot(s) on plan (See Map 4 and Table 1).
The report’s information about soil P availability can assist graziers to improve:
- the efficiency of supplementation for livestock production
- fertiliser application
- legume development.
Map 4 shows the indicative plant available P concentration using digital soil mapping methods based on site data collected during soil surveys. The red points on the map are the locations where soil samples have been collected and analysed. Some of the samples may date back to the 1960s. The specific soil test used is bicarbonate extractable P (Colwell-P), measured in parts per million (ppm), the same as mg/kg.
Bicarbonate extractable P is a better measurement of biological availability than total P, but it may still not indicate accurate plant availability in all cases. For example, in iron-rich soils, P may be less available to plants than noted in this analysis due to the P-binding nature of these soils.
Note: As the information in these reports is 'indicative', users (i.e. land managers, consultants etc.) are encouraged to always back up the data provided with field testing before making large management decisions (e.g. supplementation/pasture programs, stock allocation).
 © Queensland Government
Map 4. Indicative Soil Phosphorus for the Spyglass Beef Research Facility.
 © Queensland Government
Table 1. Indicative Soil Phosphorus for the Spyglass Beef Research Facility land types.